Monitoring serialport2namedpipe Windows Service running in Azure Arc-enabled server
Posted on: September 18, 2023In my previous post, I wrote about
Running Home Assistant in Hyper-V with Zigbee USB Gateway.
Key point from that post is that I have deployed serialport2namedpipe
as Windows Service that enables the communication between USB gateway and Home Assistant.
I also mentioned in that post that I’ve installed Azure Arc and AKS Edge Essentials on the same machine. So, in another words, we have Azure Arc-enabled server with AKS EE deployed to it. AKS EE itself is also connected to Azure Arc making it Azure Arc-enabled Kubernetes cluster.
I have been using these building blocks for various demos and for my own learning.
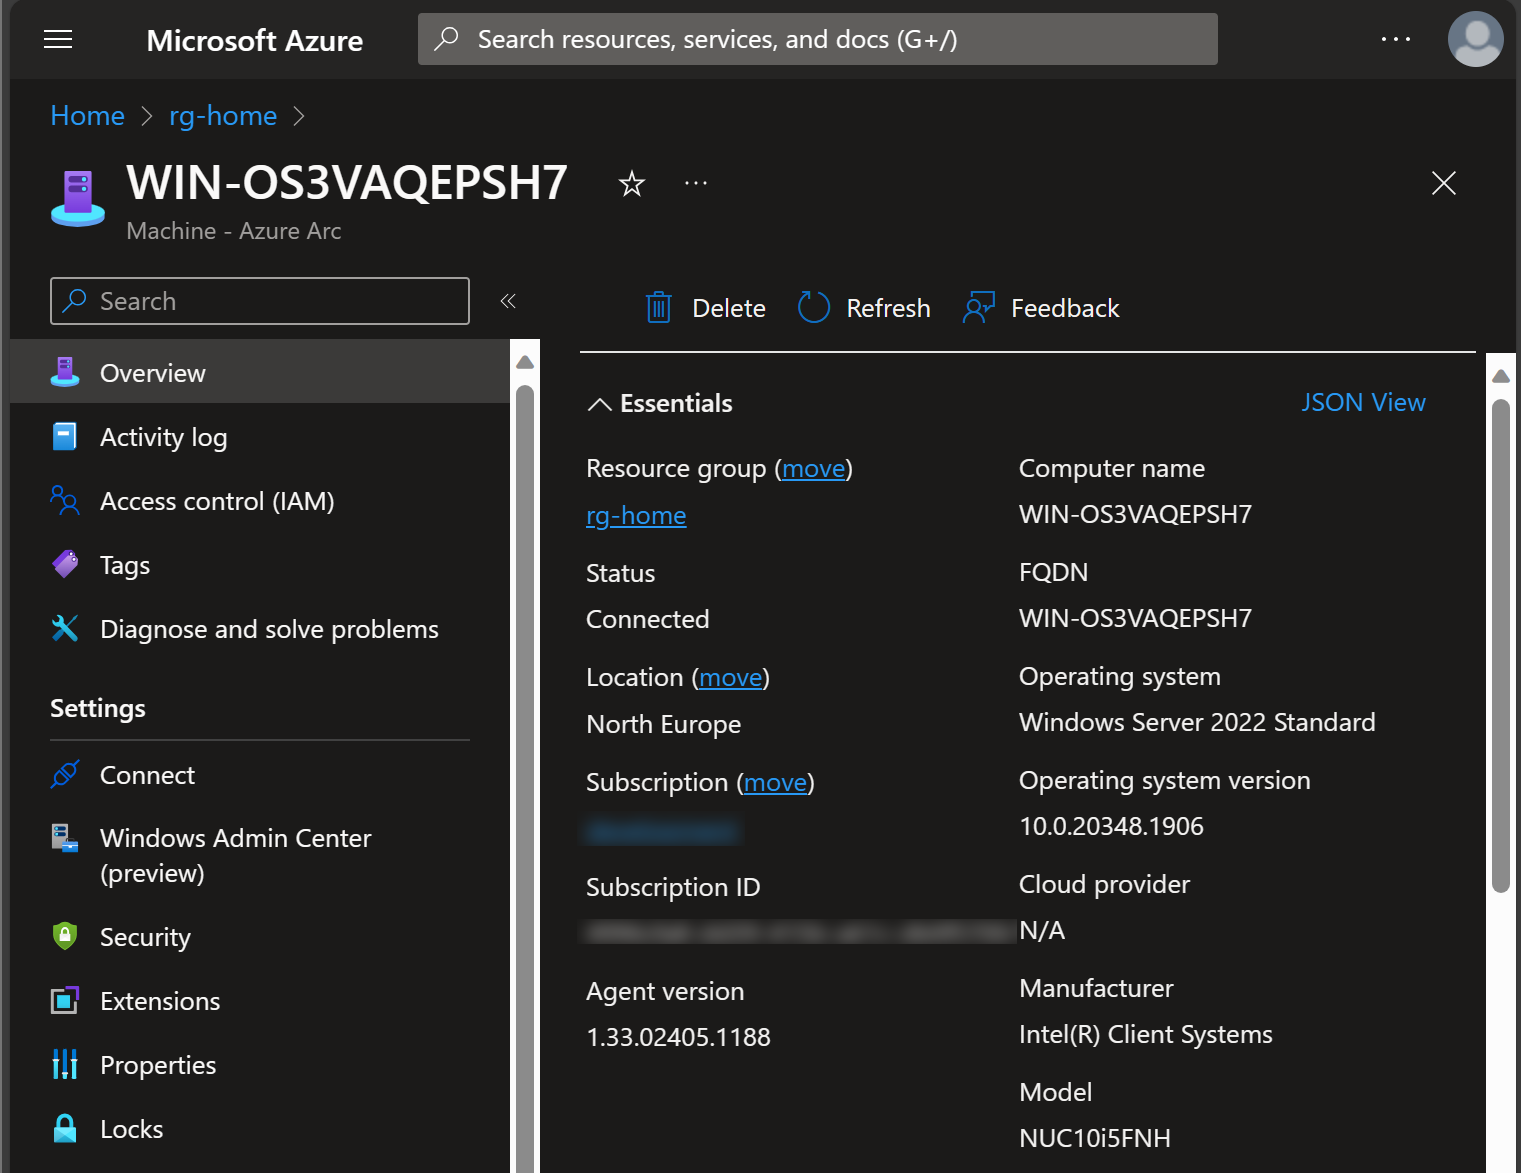
Here is my Azure Arc-enabled server in Azure Portal:
For my containerized IoT & Edge workload demos, I use of course AKS EE. In the future more and more workloads are going in that direction.
However, I want to mimic different customer scenarios and real environments, which typically mix & match workloads across Linux and Windows.
Luckily, in this setup you can seamlessly integrate with each other. This is quite a common scenario across customers in their IoT and Edge solutions.
Here is one example how you can publish an endpoint from your container running AKS EE by using Load Balancer from Kubernetes:
apiVersion: v1
kind: Service
metadata:
  name: echo-svc
  namespace: demos
spec:
  type: LoadBalancer
  ports:
    - port: 80
  selector:
    app: echo-deployment
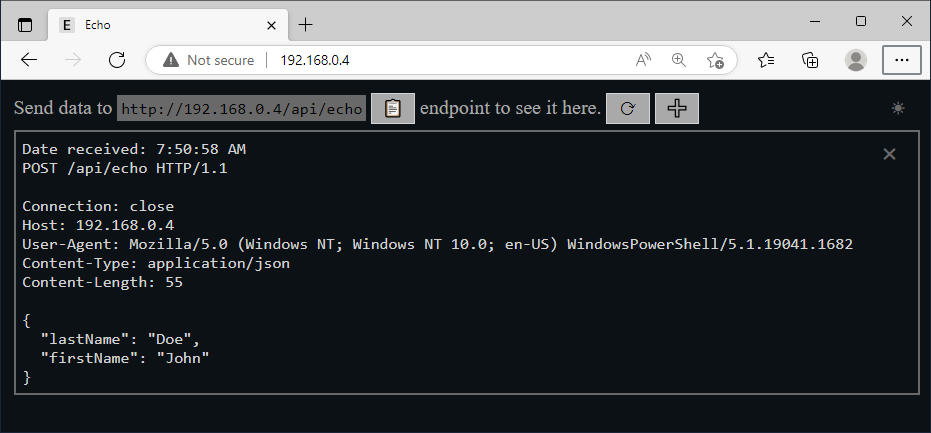
Application is now reachable from Windows:
I will write future posts about this setup and GitOps but for quick reference, here is an example GitOps configuration for AKS EE with two sample apps:
 JanneMattila/aks-ee-gitops
For monitoring this solution, we can leverage Azure Monitor and its many capabilities. To demo one specific monitoring scenario, I chose demo that we presented at the Microsoft Finland Partner Architect Day already in 19th of November 2019 jointly with my colleague Tomi Pietilä. Demo is about monitoring Windows Service using Azure Monitor.
Here is a screenshot of one of the slides that we showed in our presentation:
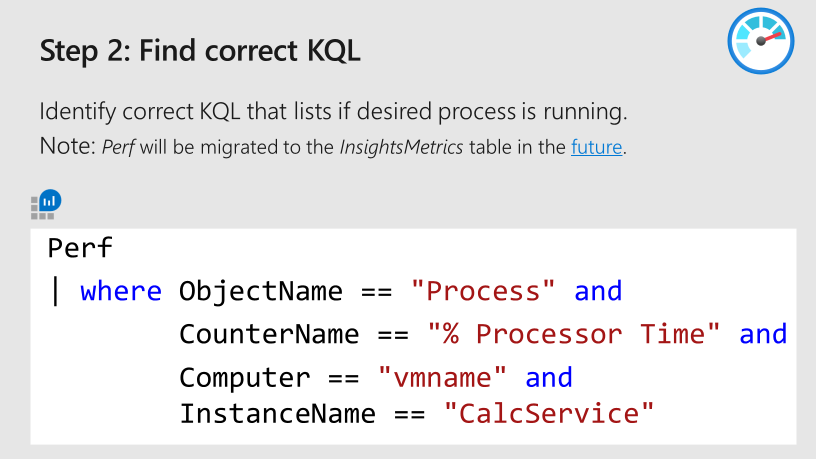
The idea is to monitor running processes by collecting performance counters from the machine.
This requires Process(*)\% Processor Time performance counter to be enabled for collecting processor usage per process.
When that is enabled, we can now query that data:
Perf
| where ObjectName == "Process" and
        CounterName == "% Processor Time" and
        Computer == "WIN-OS3VAQEPSH7" and
        InstanceName == "SerialPort2NamedPipeConnector"
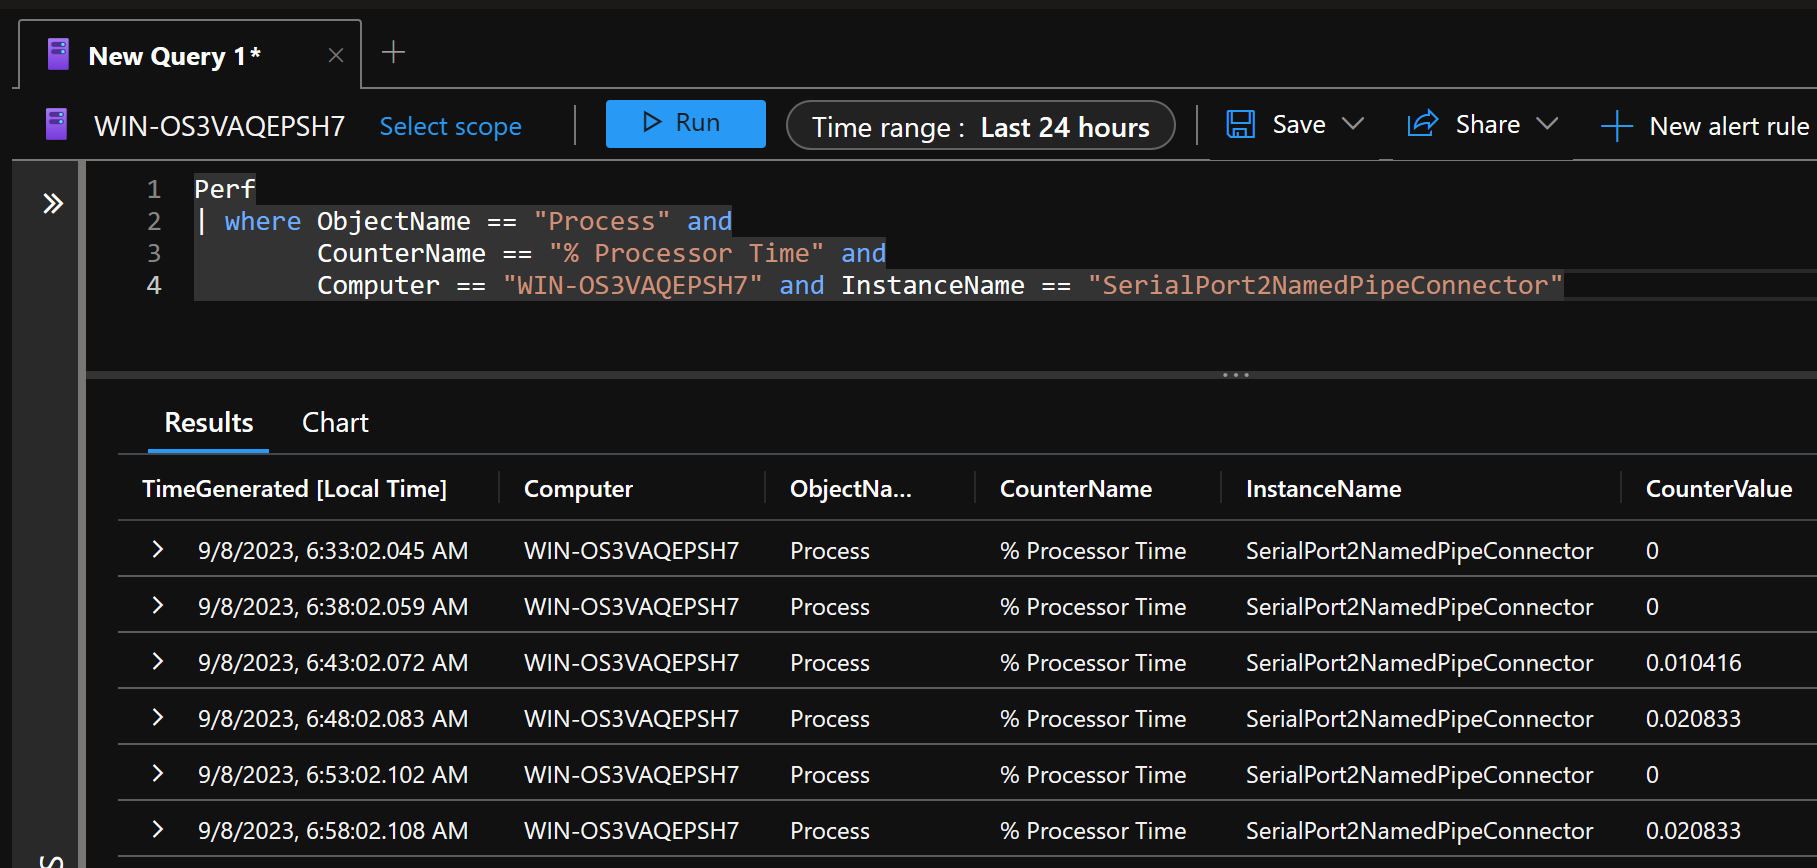
If you don’t get correct and expected data from that query as end result, then you know that something is wrong with your process.
This log query can now be connected to other capabilities like alerting and notifications. To read more about log query alerts checkout the Tutorial: Create a log query alert for an Azure resource.
Of course, Azure Arc has tons of other capabilities that enable you to see that if things are not running in the machine as expected.
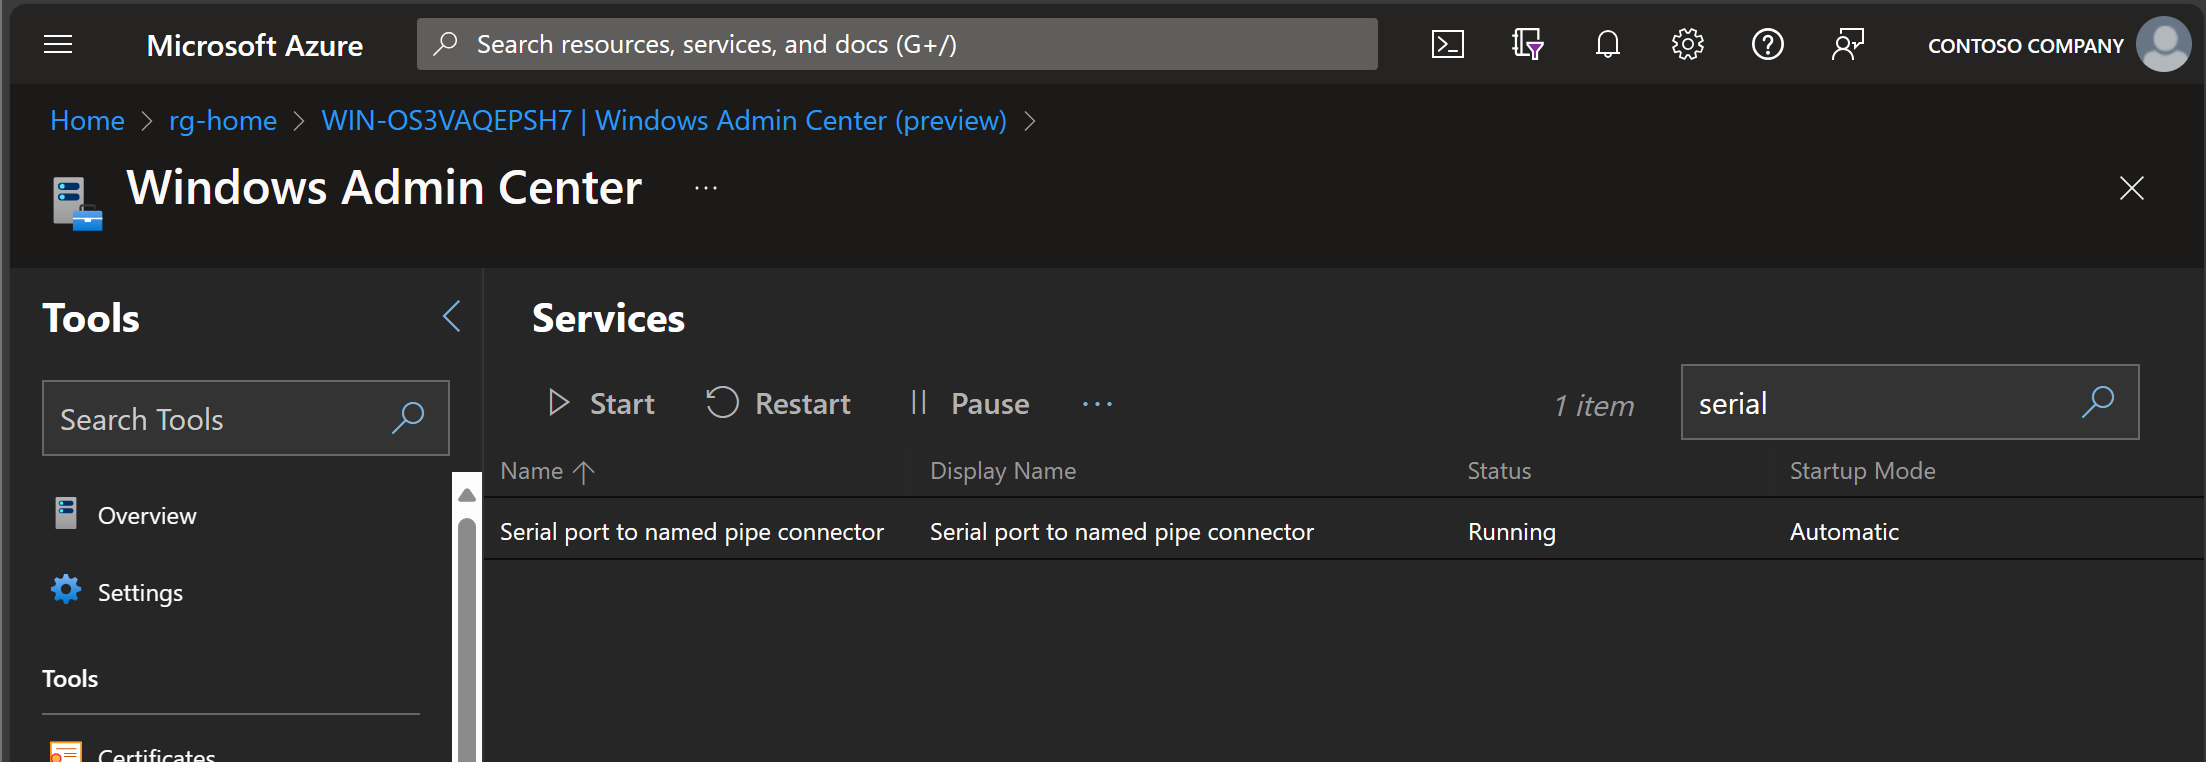
One such capability is Windows Admin Center. You can use Services view to see the state of Windows Services directly in Azure Portal:
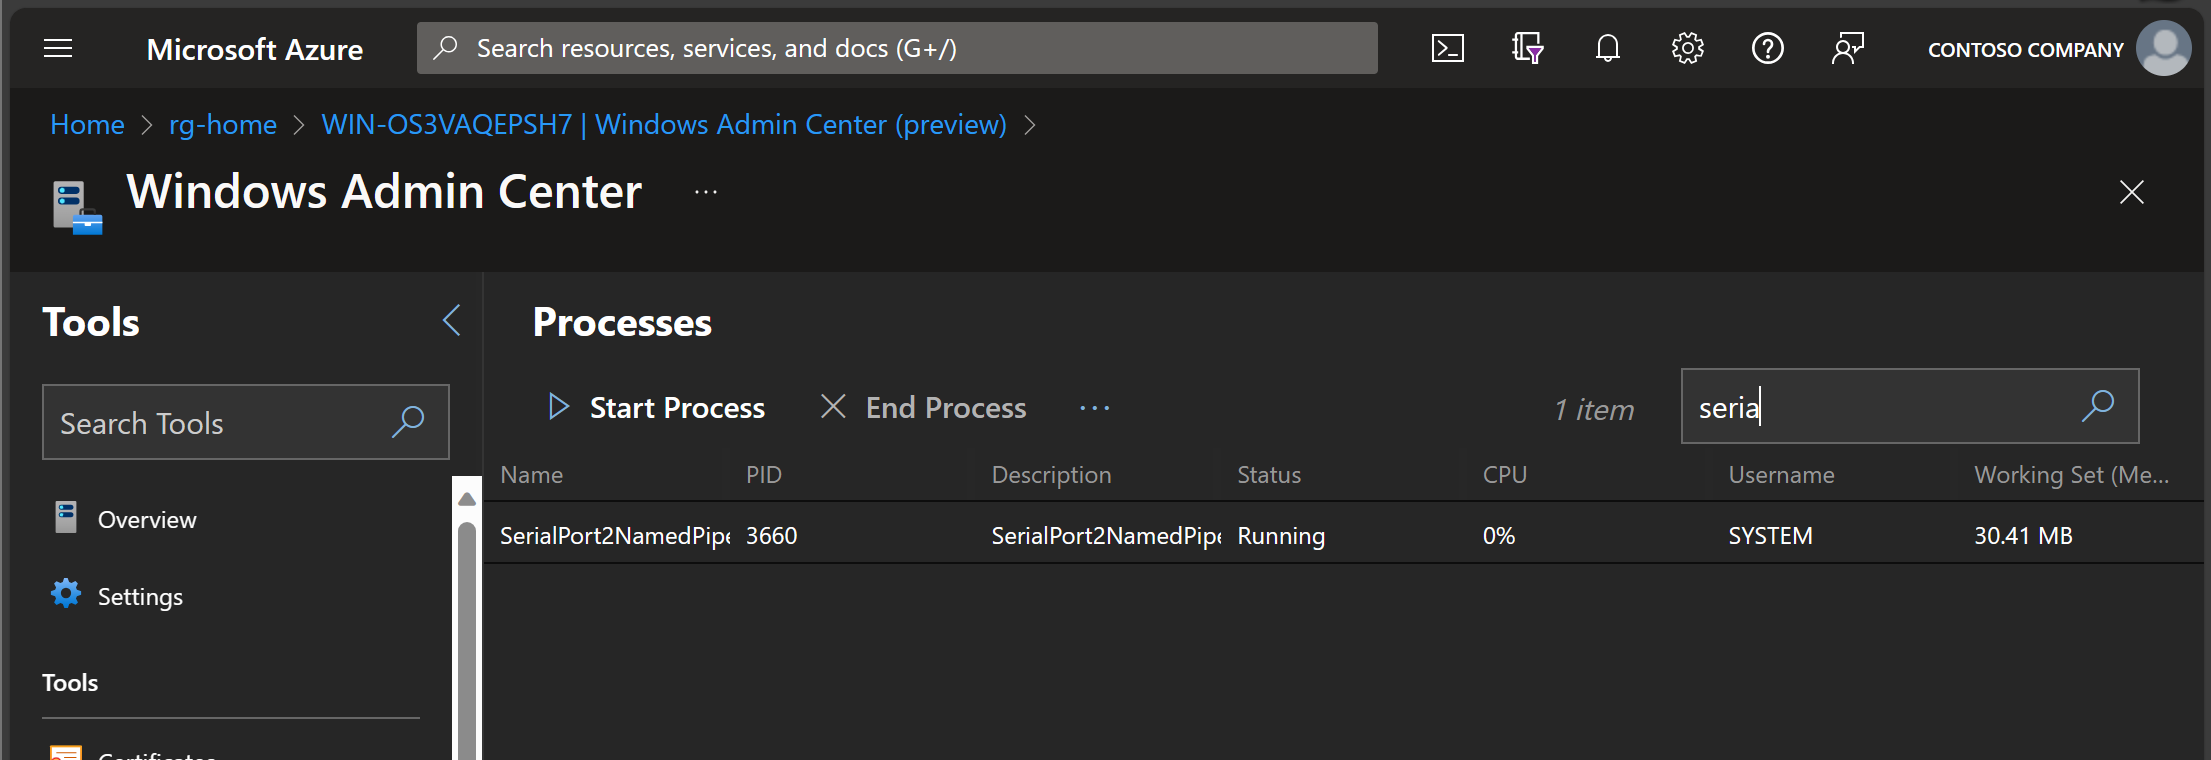
Similarly, you can use Processes view to see which processes are running:
I will be covering more Azure Arc capabilities in future posts as well.
Hope you find this interesting!